Changelog
Follow up on the latest improvements and updates.
RSS
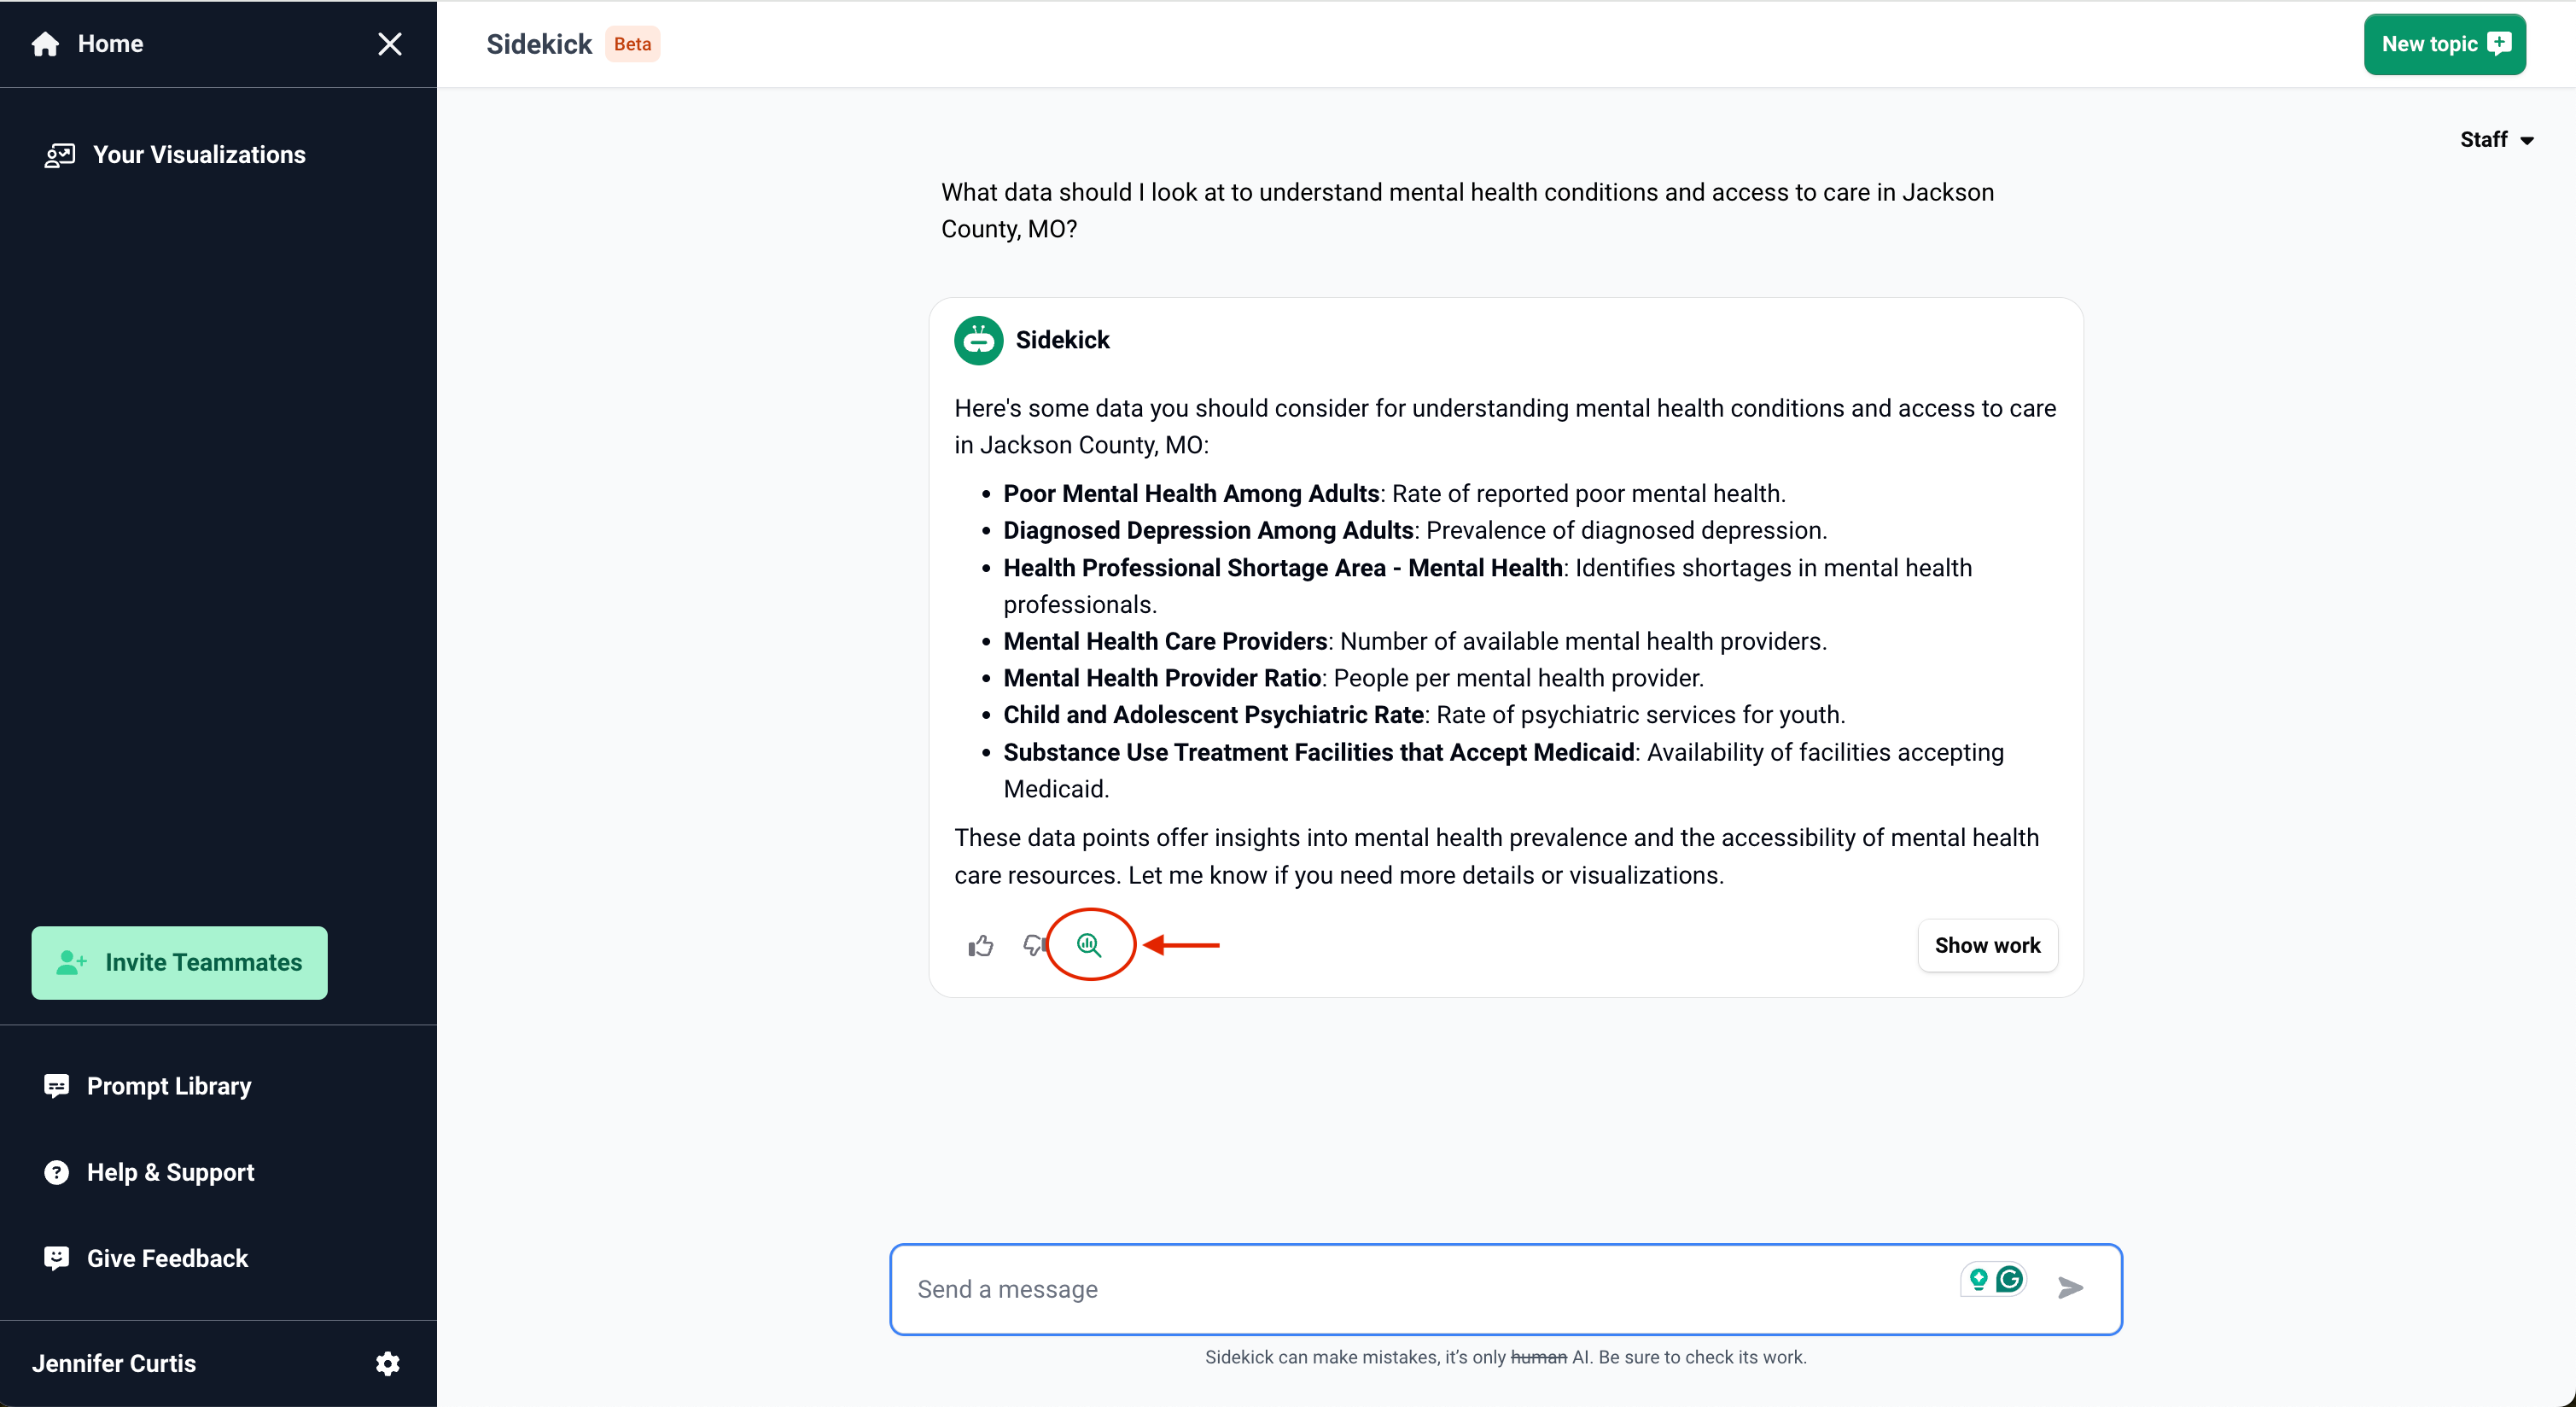
One of Sidekick’s core capabilities is recommending data tailored to your specific problem or project. With this update, now you can use Sidekick to find the right data and then send the data list over to Seek, where you can easily add many additional data points, manipulate how the data is presented, and quickly explore it in charts and maps.
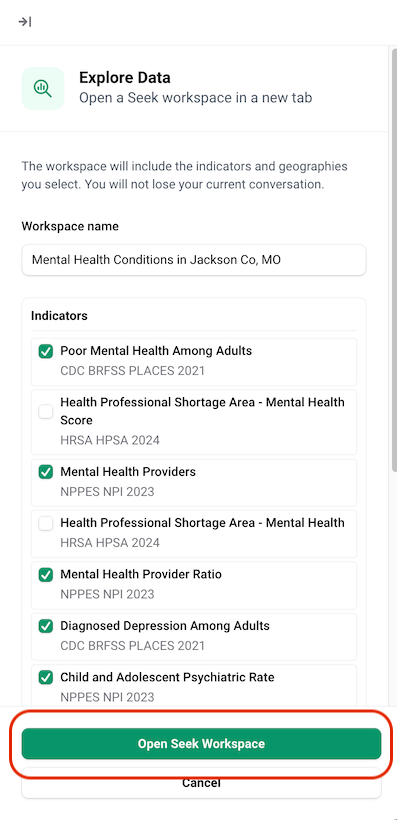
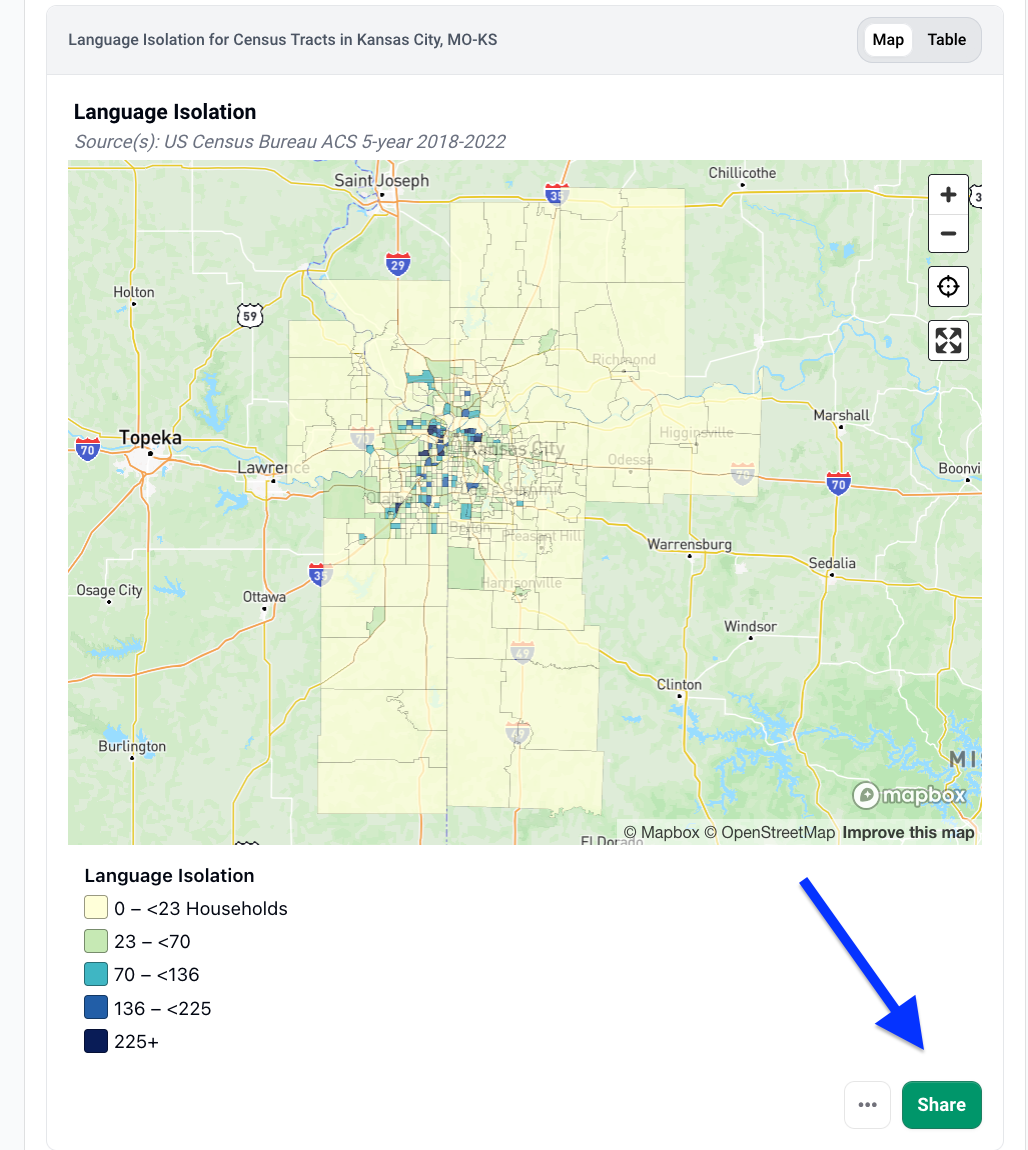
Generate and share a public link to visualizations you create with Sidekick. Just click share, toggle to public, and copy and paste the link. This is a great way to help others - colleagues, electeds, and other community stakeholders - understand and use data in their own work and decisions.
Have you heard? Every mySidewalk customer gets
5 free Sidekick Beta licenses
to share with their teammates and now you can invite teammates directly from the app. 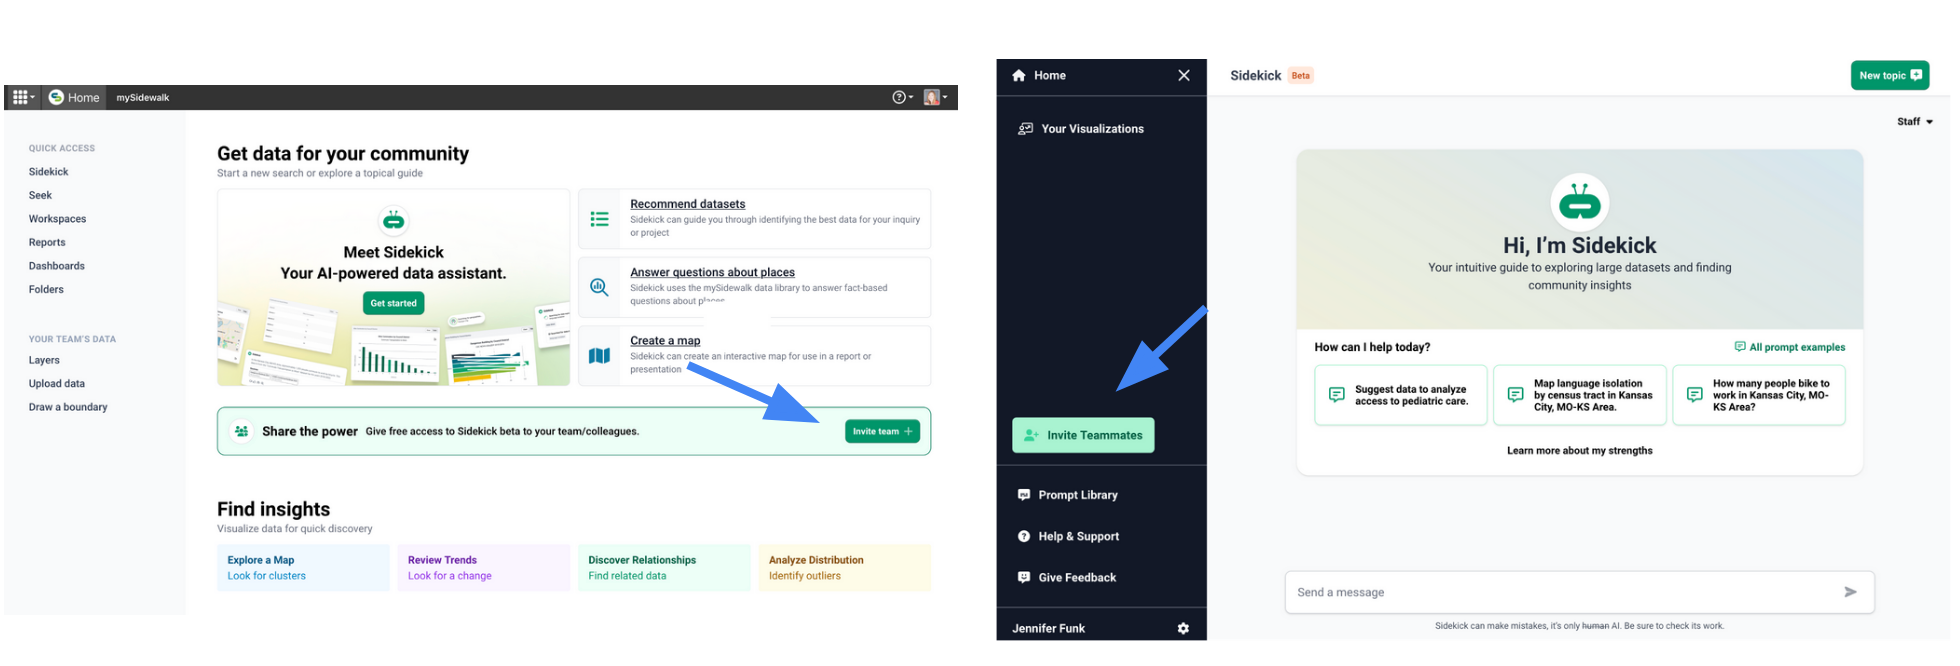
When you send an invitation to one of your teammates, they'll receive an email letting them know they can sign up and get instant access to Sidekick. Learn more.
Note: Each invitation provides Sidekick only access through the duration of the beta. Referred users will not have access to other tools that may be included in your subscription, like Chart and Chart.
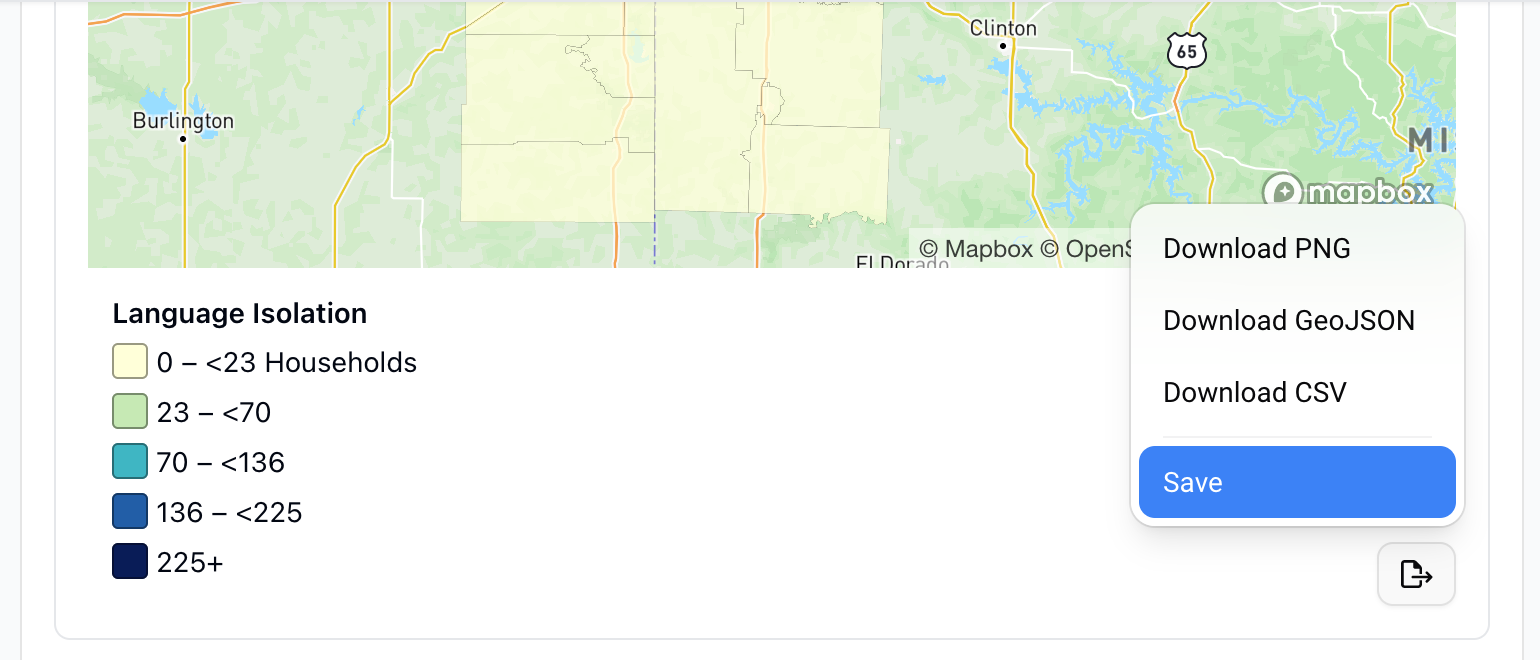
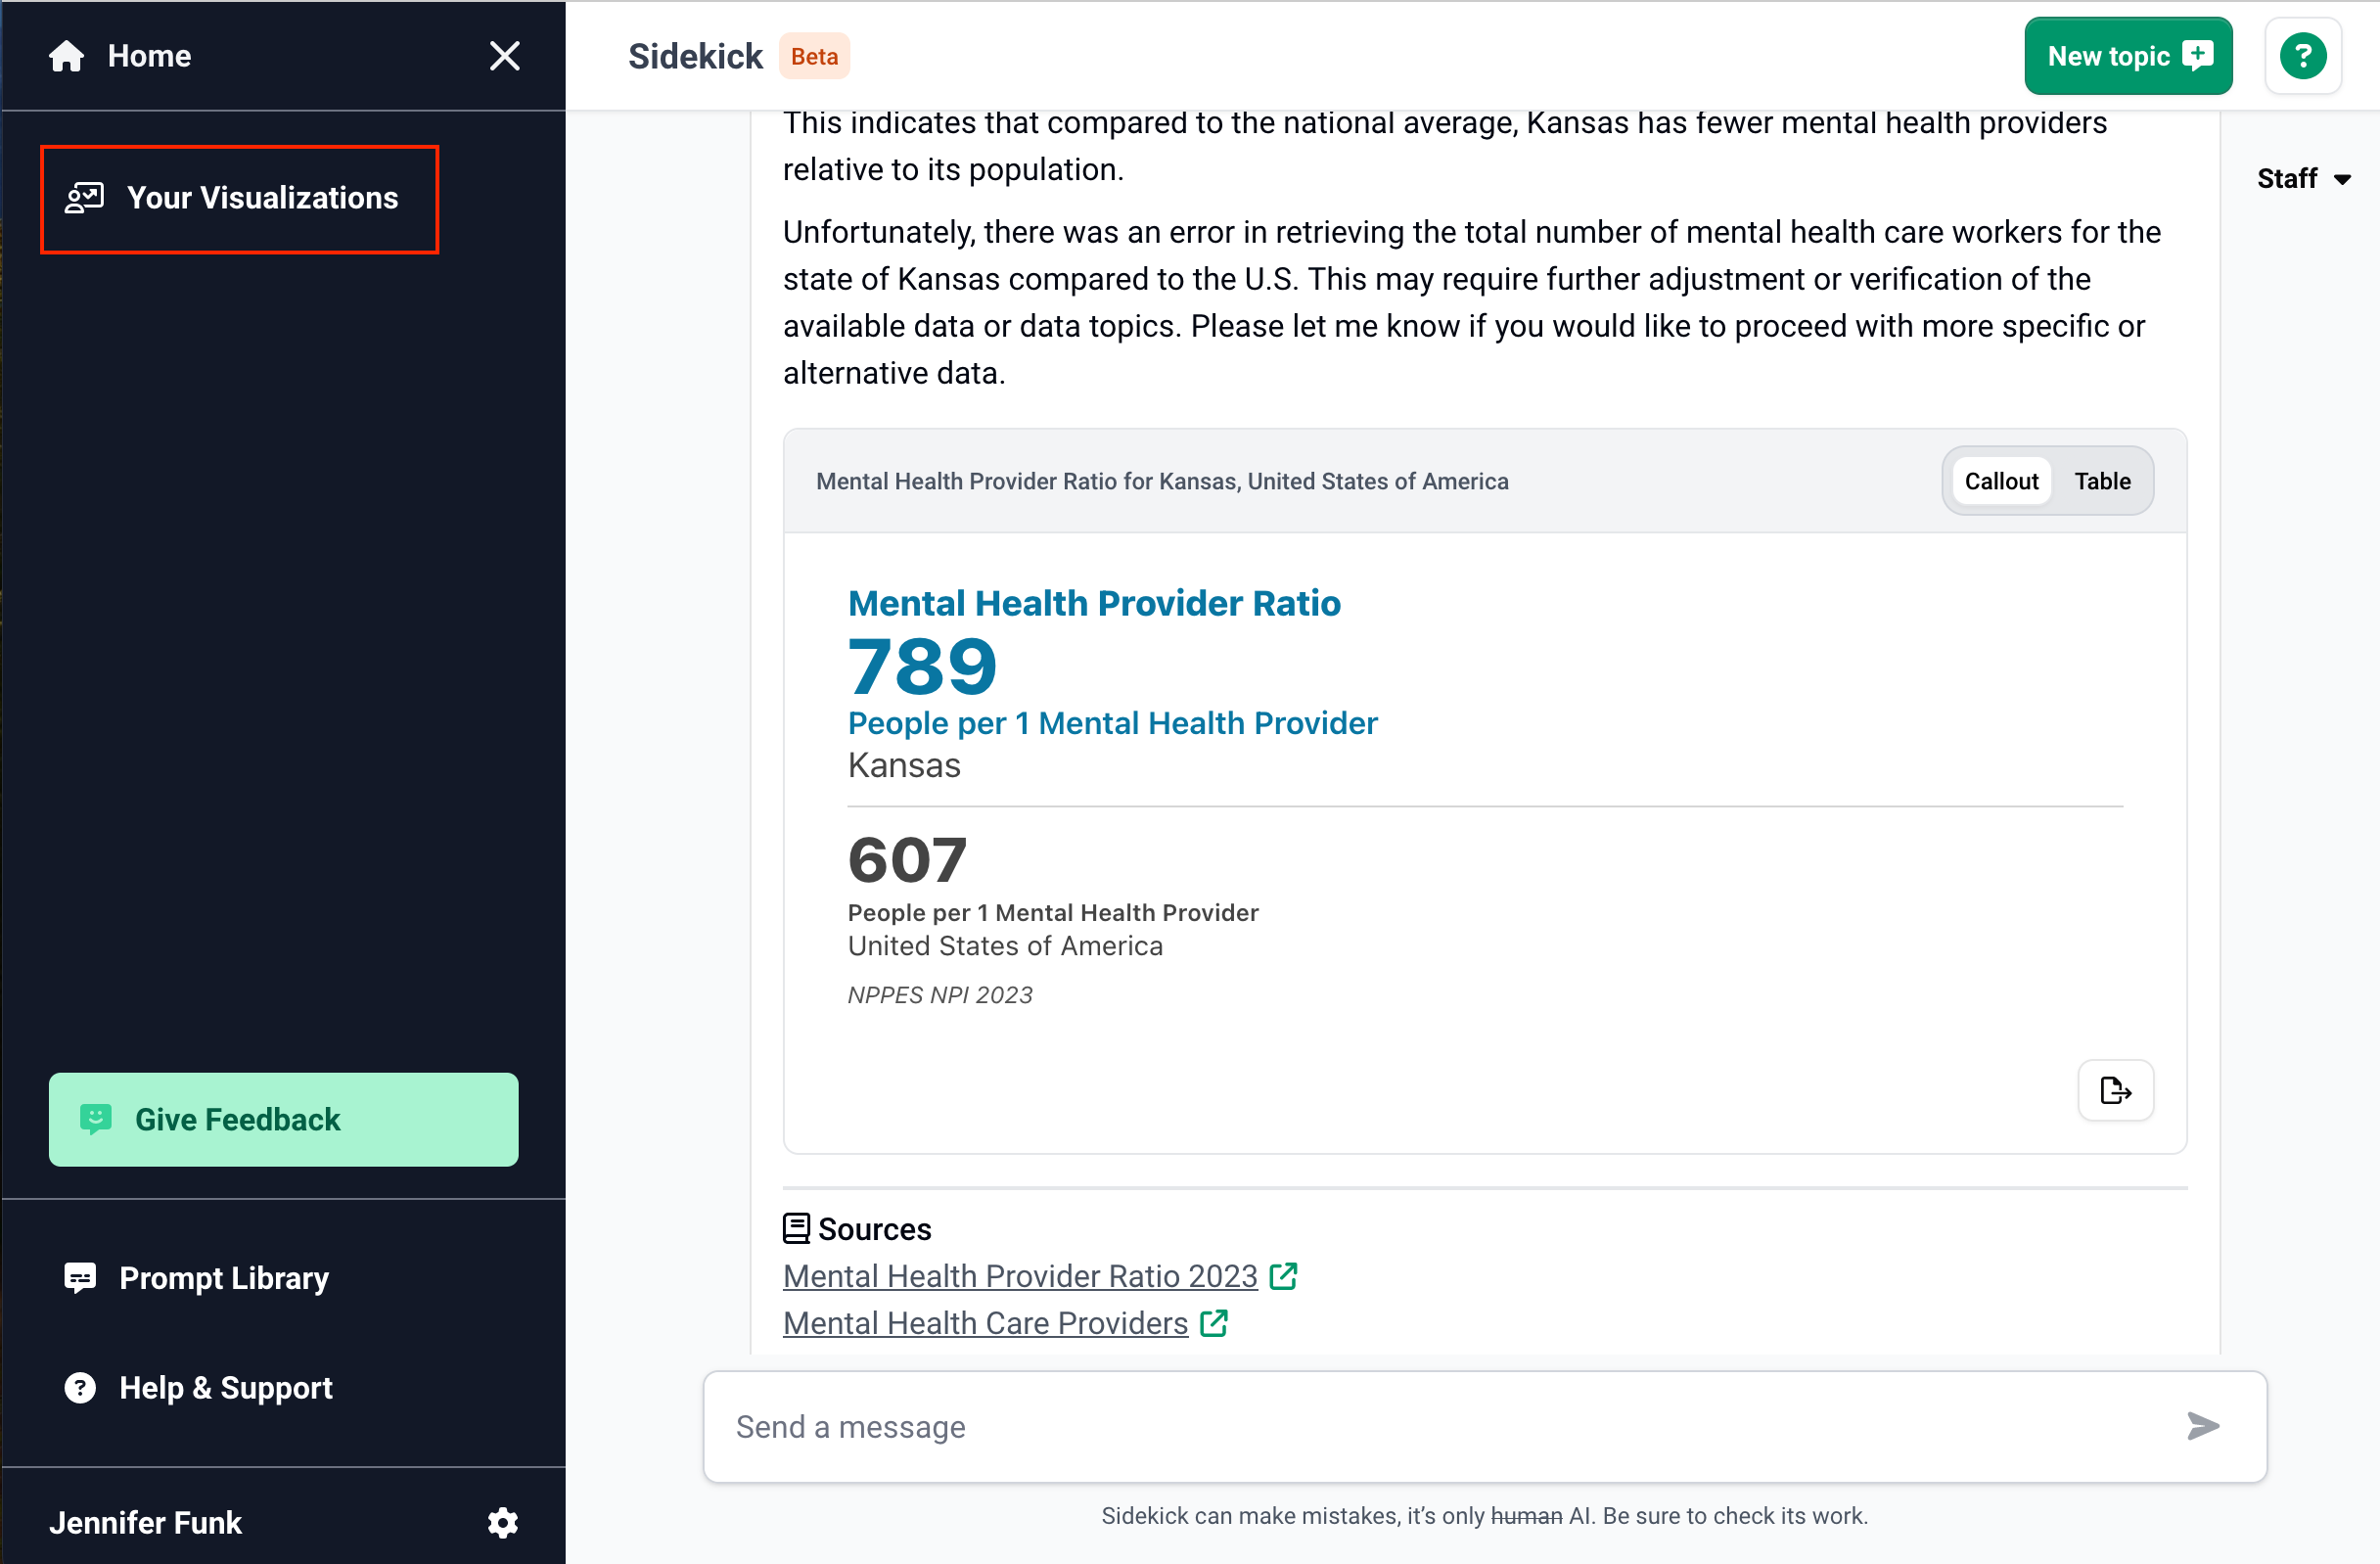
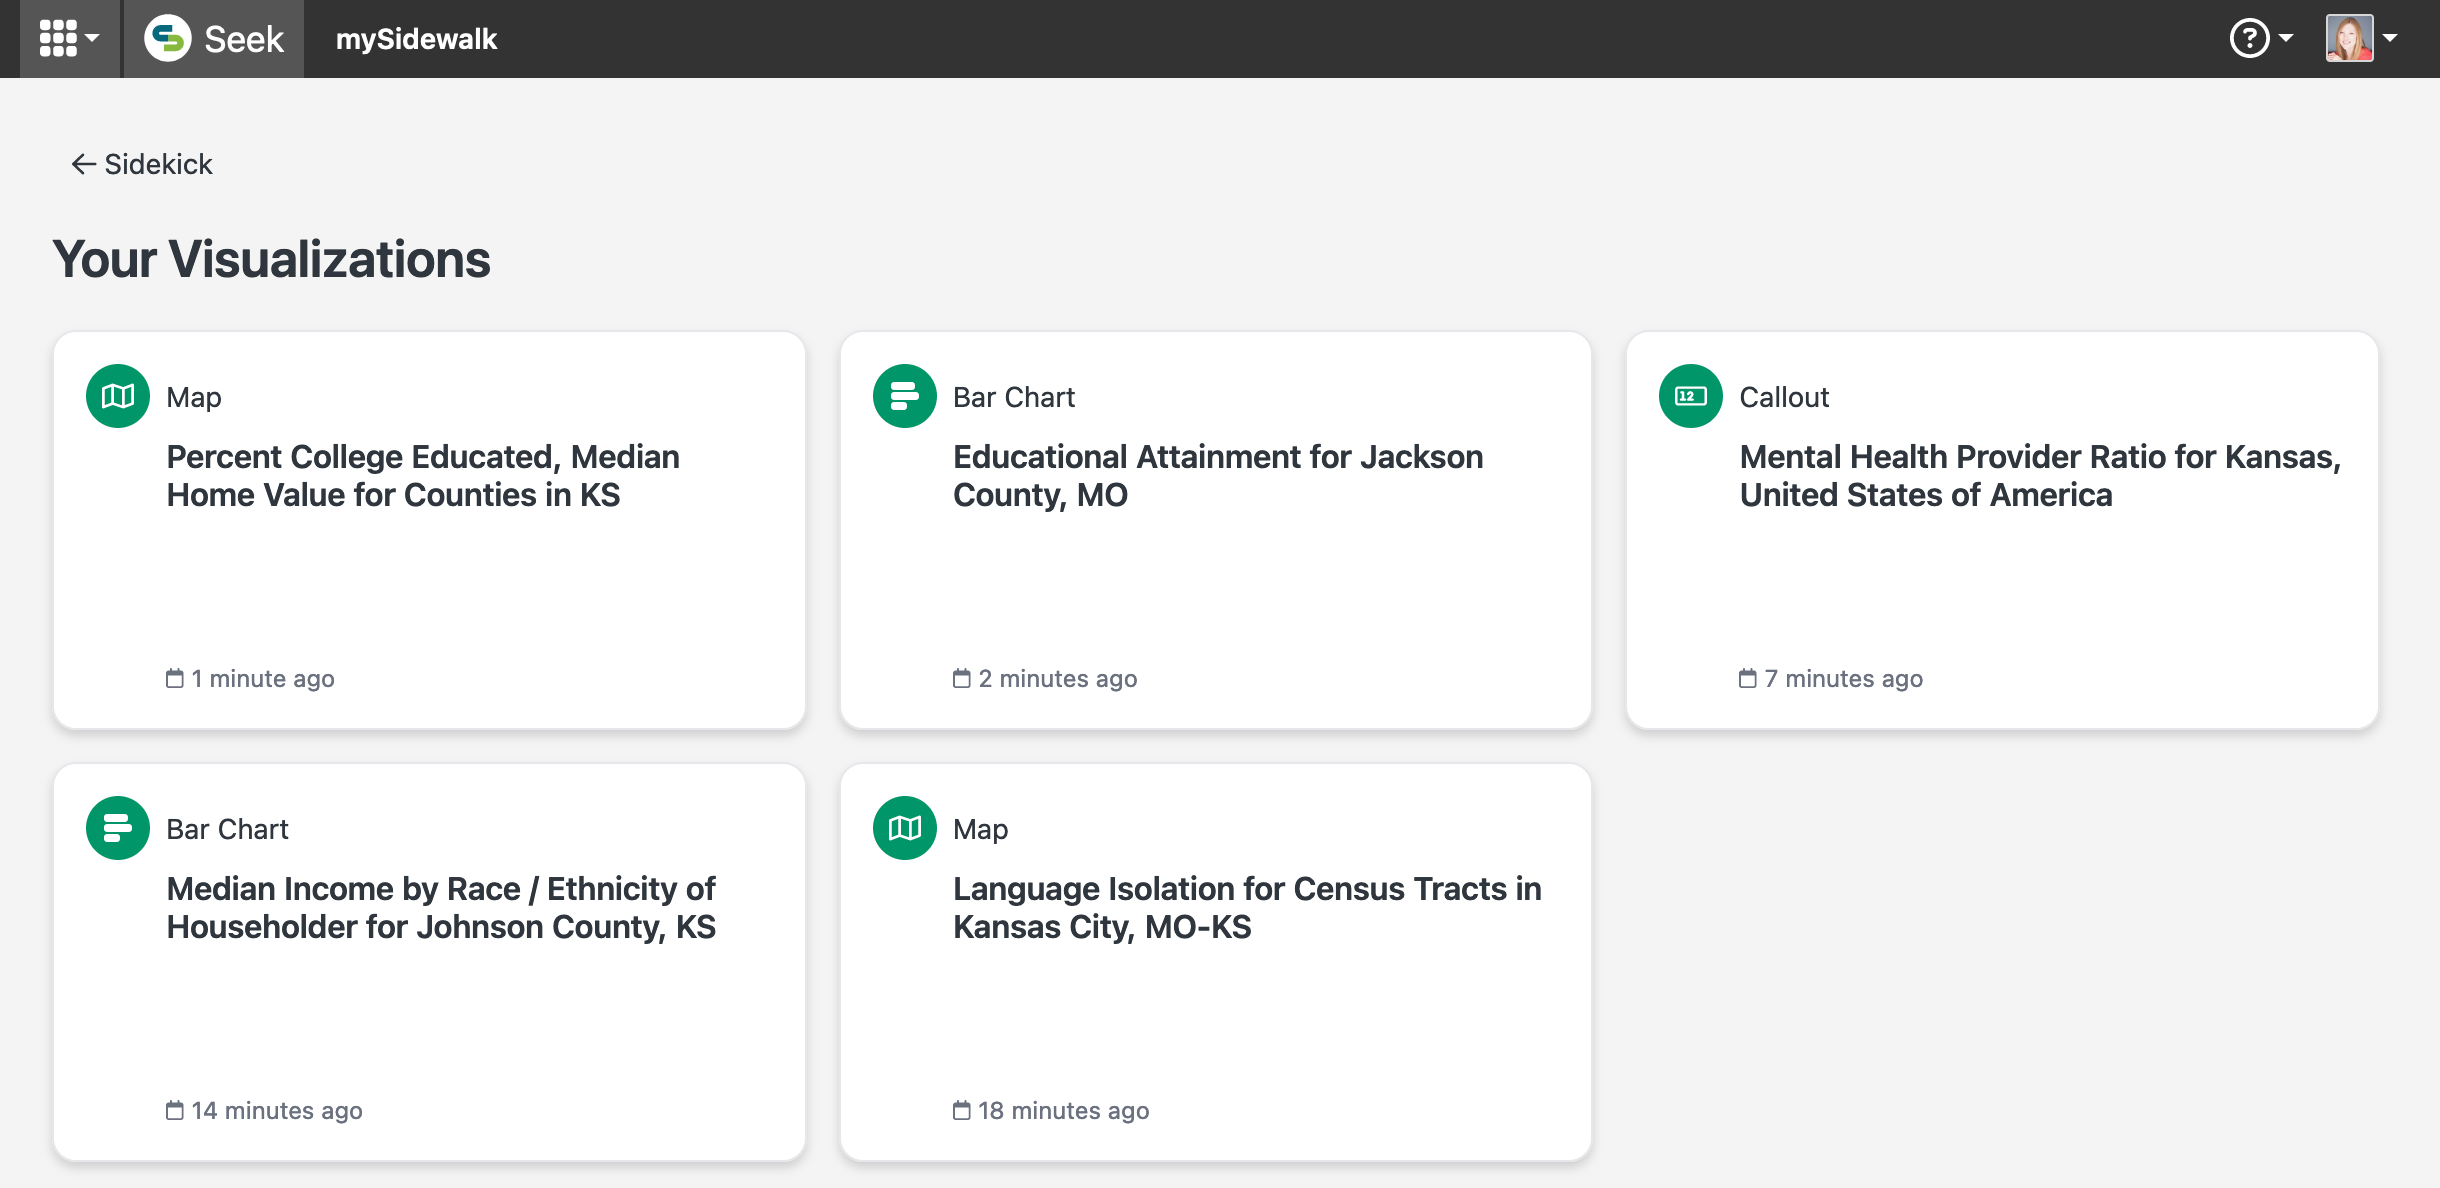
Save visualizations generated by Sidekick, so you can return to them at any time - and if you have Chart access, send them to a report or dashboard page.
Saved visualizations can be accessed via the left sidebar, where Your Visualizations opens up your Visualization library.
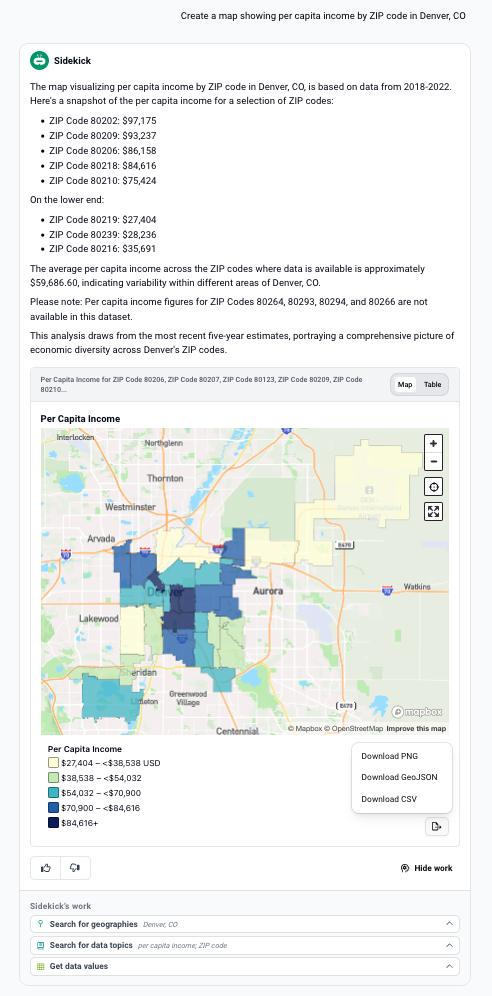
Sidekick can generate an interactive map based on a user's prompt, and they can download the map and data to share with others.
Now you can ask Sidekick to rank places (counties, cities/towns, ZIP codes, neighborhoods, etc.) based on a particular data topic or metric.
For example, you can ask Sidekick for:
- The neighborhoods with the worst and best access to jobs
- The census tracts with highest rates of heart disease
- The ZIP codes with the most manufacturing jobs
Use this information to inform strategic planning, resource allocation, and grant writing.
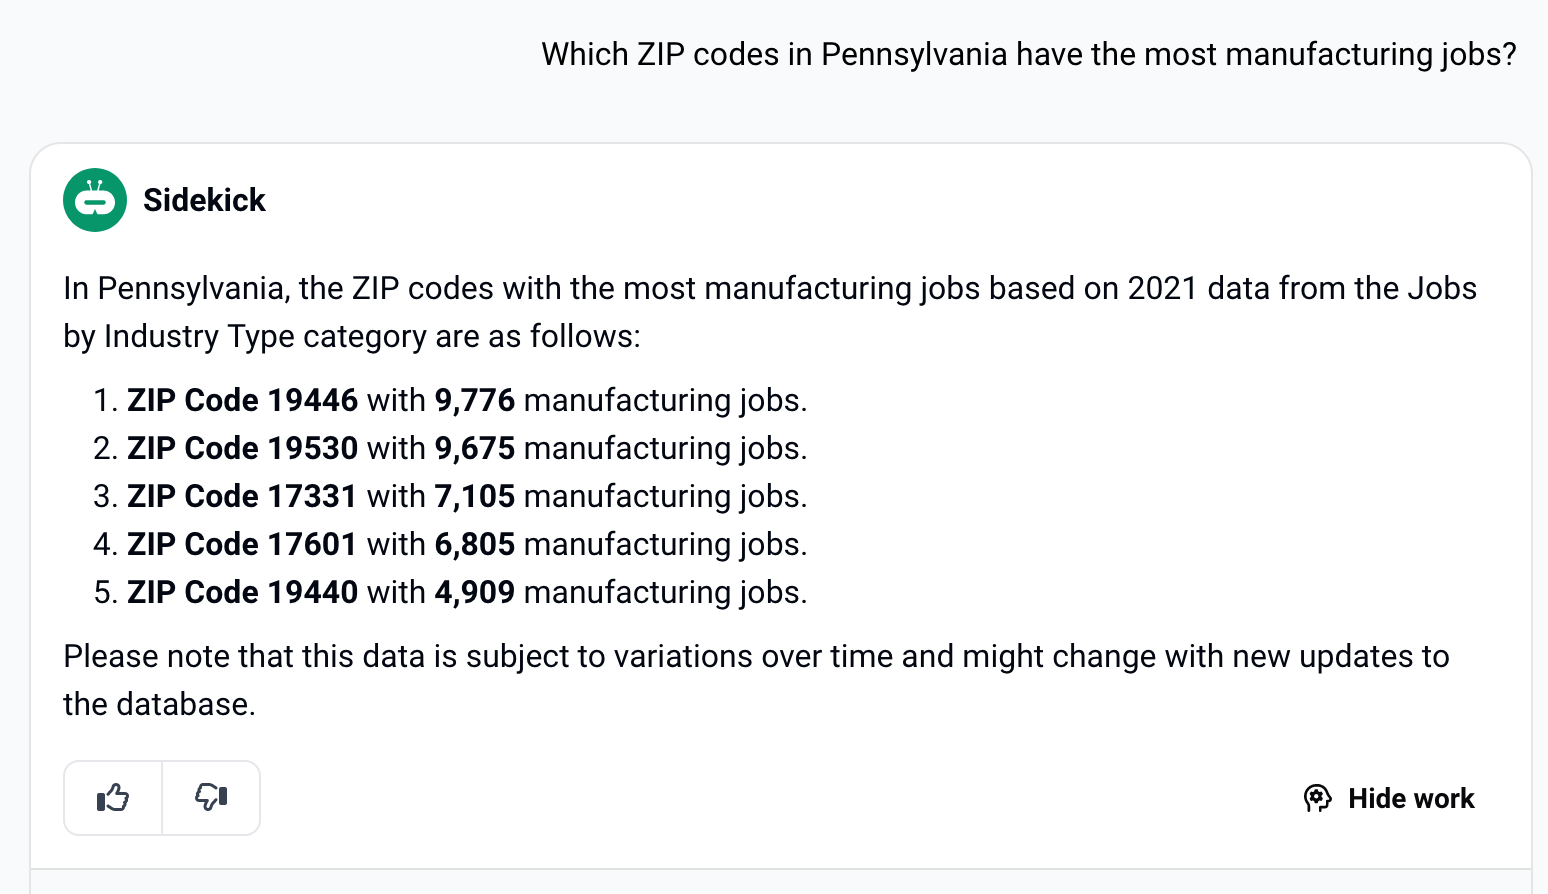
Now, for every query you make in Sidekick, you see exactly what Sidekick did to find an answer. The feature is designed to increase transparency and trust, and to improve performance. Here’s how:
Check Sidekick’s work
Use the feature to confirm if it queried the right location and used real data from the mySidewalk library. Here’s an example of how it works with a query on median rent.
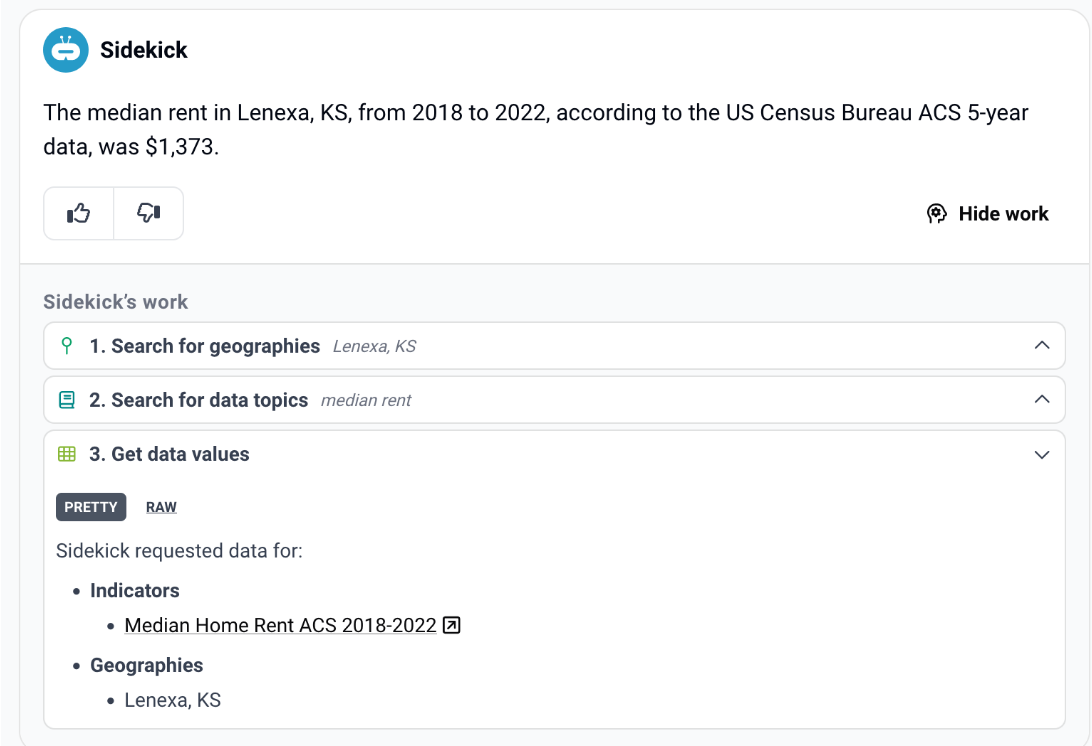
You can see that it did, indeed, use the right location and it includes a link to the data source so you can not only confirm the data used, but also learn more about it.
Collaborate better
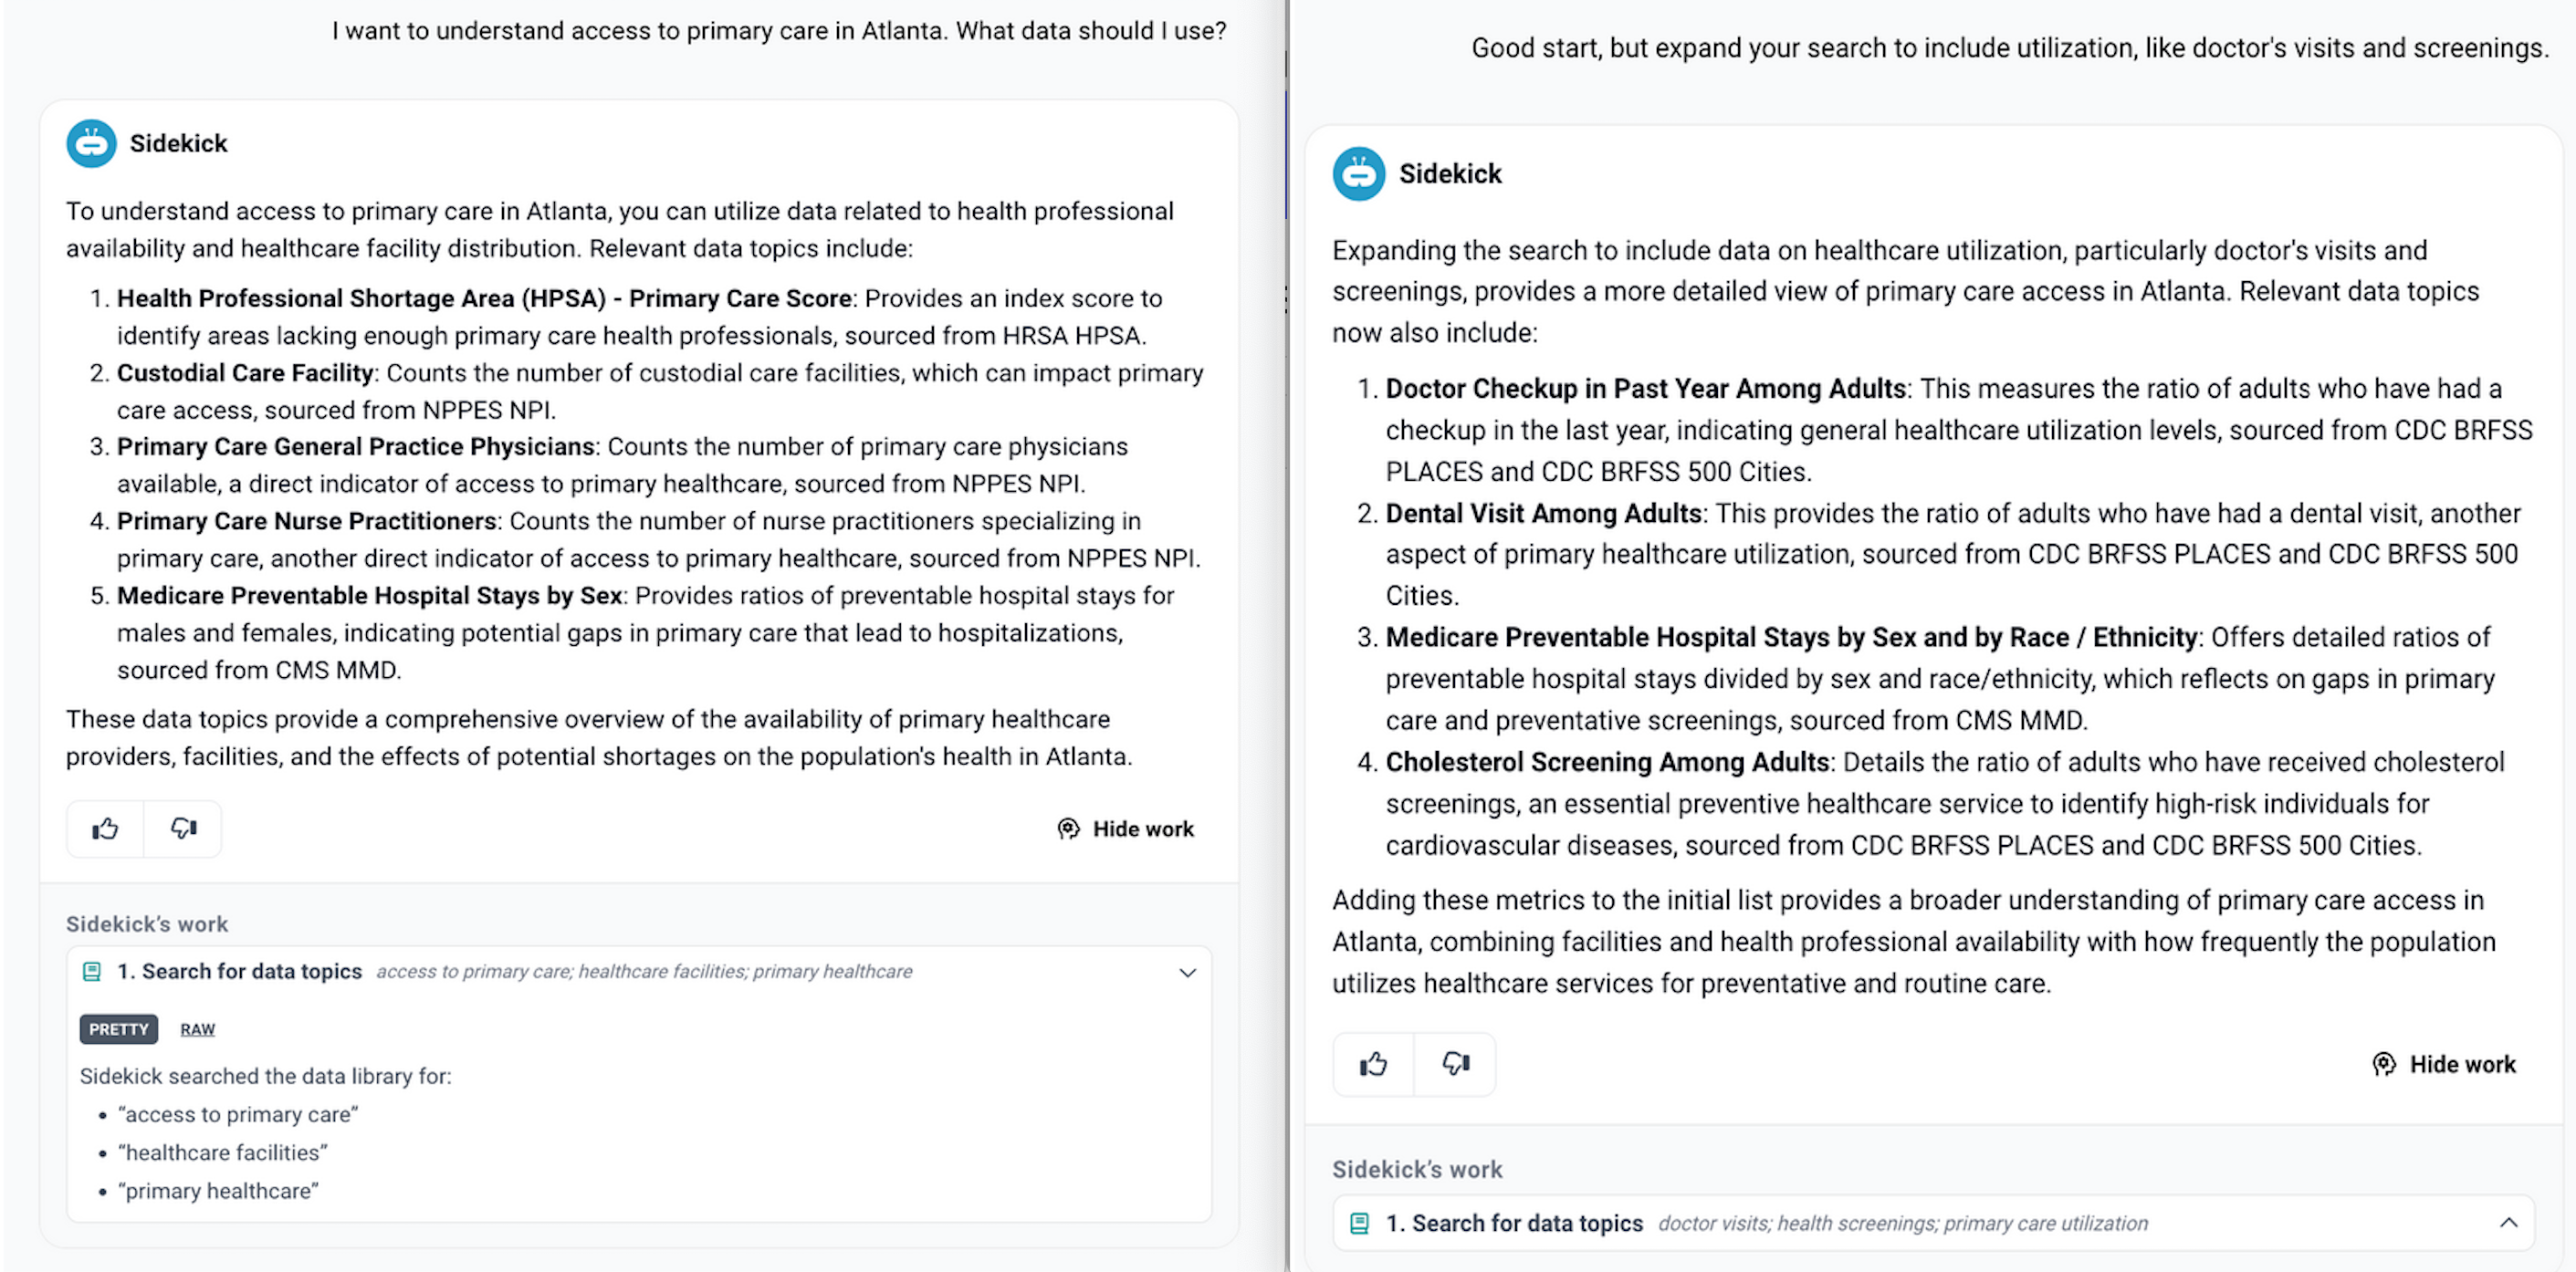
The feature can also help you fine-tune your conversation with Sidekick. By revealing the exact terms and datasets queried, you can refine your requests for more targeted outcomes.
Now a Sidekick error message remains below the message that caused the error rather than moving with each new message.
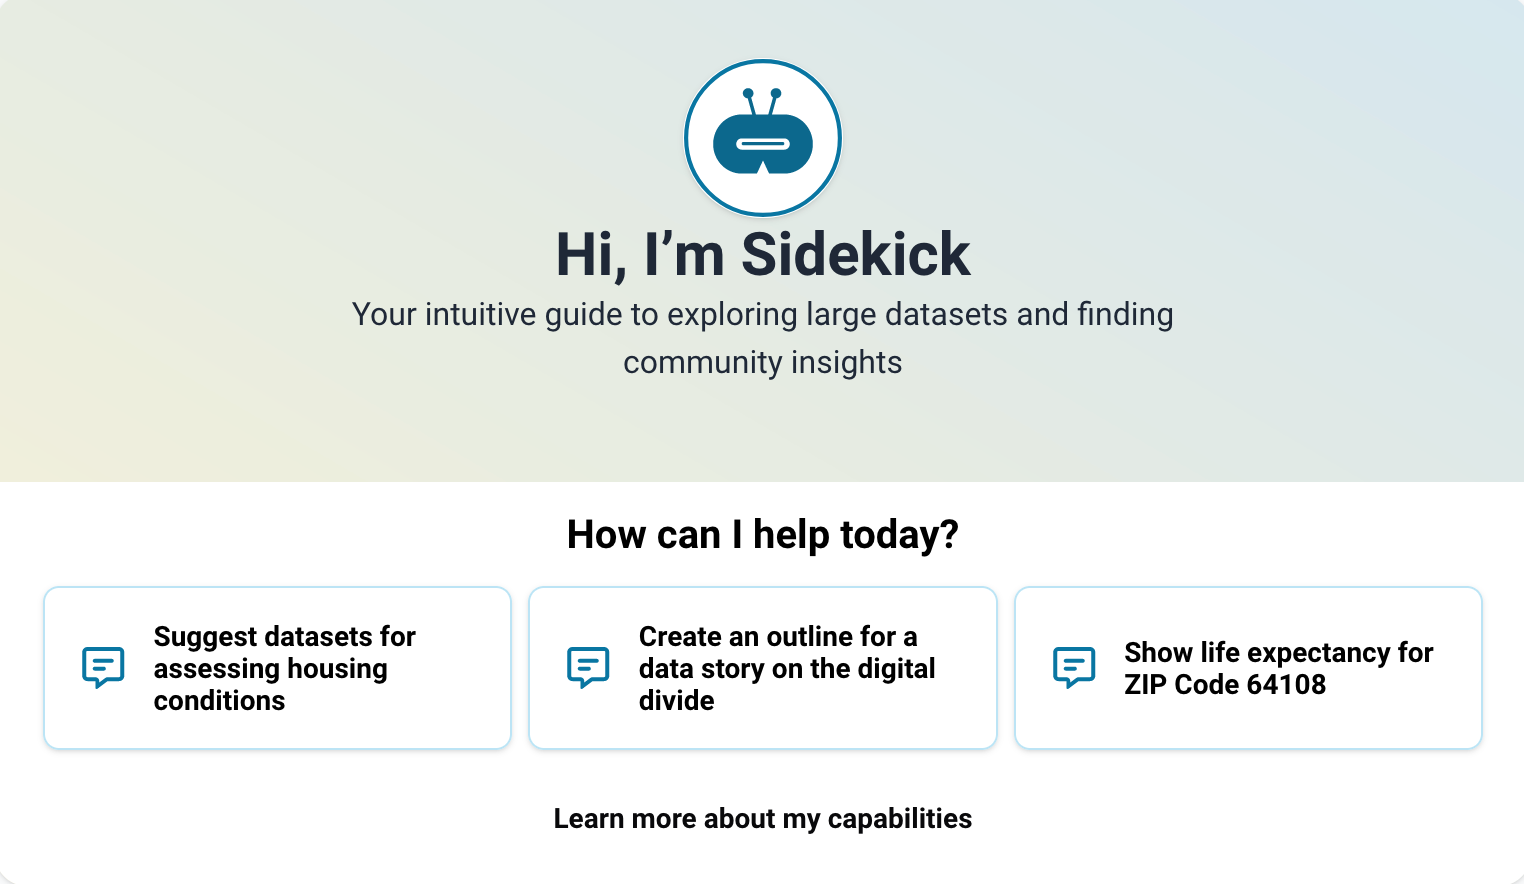
Including a new look for the empty state screen
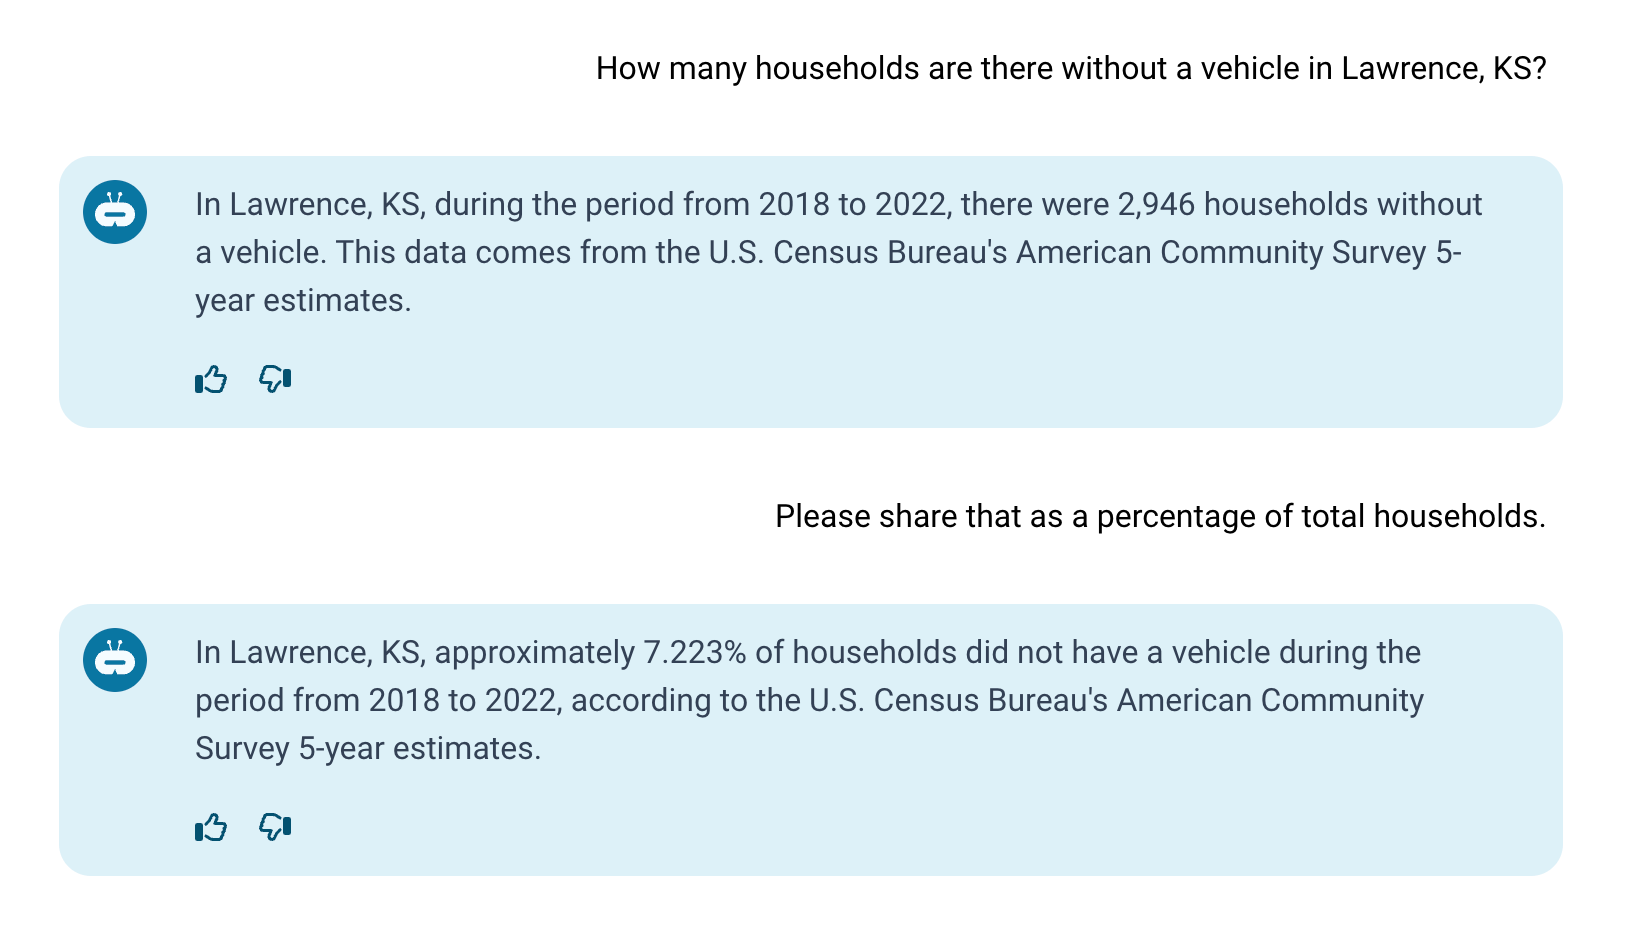
Sidekick now has the ability to normalize data and provide percentages based on relevant user queries
Load More
→